Measuring Currents
Water current, like water level, was once measured exclusively by mechanical devices. Now it’s almost entirely done by electronic instrumentation with no moving parts – a fortunate change since current meters must operate for extended periods of time underwater where propellers, rotors, and other parts are easily fouled by objects in the water or by marine growth.
 The first new instrument to emerge was the Electromagnetic
Current Meter (ECM) – a device that normally senses horizontal current flow
along two axes perpendicular to each other. The typical ECM measures current by
inducing a magnetic field around a spherical sensor head, then measuring the
electromotive force that results from a conductor (water) moving through the
field. The best results are achieved only after careful calibration of the ECM
in a flume or other controlled flow environment.
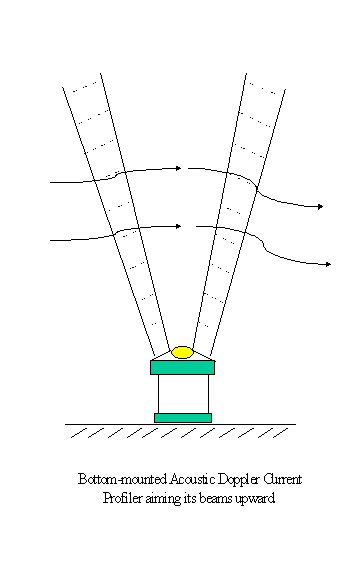
The newest instrument today is the Acoustic Doppler Meter (ADM) that determines flow along three perpendicular axes. The principle involved in an ADM is the sensing of Doppler-shifted frequency in acoustic signals bounced back from moving water particles. Some ADM instruments measure velocity at a single point located at a fixed distance from the sensor. In an ADM of the profiler type, the acoustic signals travel along multiple beams emitted from the instrument (shown at left) and are “timed” to determine the point of reflectance along the beam, an electronic trick combined with others to determine discrete points of current measurement within a series of uniformly spaced “bins” in the vertical direction. Resulting current speeds sensed in each of these bins are directionally referenced along three orthogonal axes, two horizontal and one vertical. ADM measurement accuracy is exceptionally good and the electronic components are quite stable. ADMs tend to calibrate the flume rather than the other way around
Speed and Direction? Or UV Components? – While water level measurements involve only one dimension, water currents involve at least two at the outset. A current measurement can be given either as a flow speed (e.g., knots or m/sec) and a direction in which the current is moving (usually a heading given in degrees measured clockwise from true north) or as two separate flow speeds (we’ll call them U and V) measured along two orthogonal axes. Usually the axes are oriented such that U represents the horizontal component of flow in the east-west direction while V represents the horizontal component in the north-south direction.
Which is better? That depends on the purpose. Certainly the speed and direction of current movement is easier to comprehend – a boat captain under sail wouldn’t be pleased by a current prediction given in U and V coordinates, for example. By the same token, anyone who performs an arithmetic operation as simple as averaging a pair of current measurements obtained at two different times would prefer U and V. Here’s why.
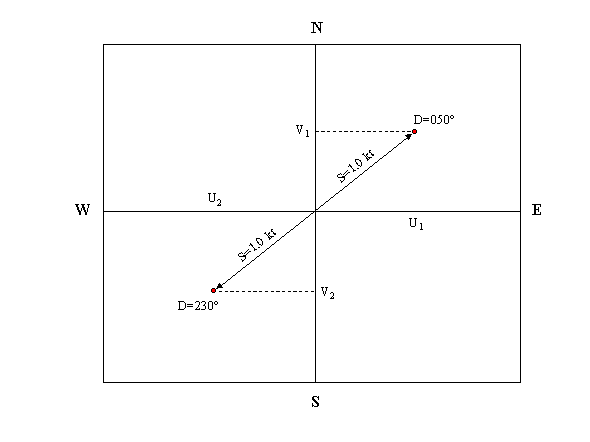
In the figure shown below, two current measurements are represented by two separate arrows (vectors) whose lengths represent the current speed (1 knot) and whose directions (050° and 230°) represent the direction in which the currents are flowing. The average speed is one knot and the average direction is 140°. Clearly this isn’t the correct result.

The average of two current vectors with the same speed but opposite directions is zero – no current in any direction. If we had averaged the U, V current components instead, that’s the result we’d get. In the diagram above, U1 is on the positive side of the vertical axis and represents an easterly flow; U2 is on the negative side of the axis and therefore represents a westerly flow. Since U1 and U2 are equal in magnitude but opposite in sign (direction), their average is zero. V1 and V2, representing the north and south flow components respectively, also average zero. In other words, the only valid average is a vector-average done with U, V components.
There are many other reasons for using U,V components in analytical work. As an example, you may have noticed the red dots at the end of each current vector in the figure above. A typical ECM or ADM instrument may record thousands of current vectors measured, say, every 6 minutes during a two-week deployment in the field. To plot that many line vectors in a single diagram would be pointless but a sense of the overall current distribution can be gained from a U,V “scatter plot” showing just the red dots and not the arrows.
