Try Analyzing & Predicting Your Own Tides and Currents!
by John Boon, Emeritus Professor, SMS/VIMS
SIMPLYTIDES – A SET OF MATLAB PROGRAMS FOR TIDAL ANALYSIS AND PREDICTION USING MATLAB VERSION 6 GRAPHICS AND GUIs – by John Boon
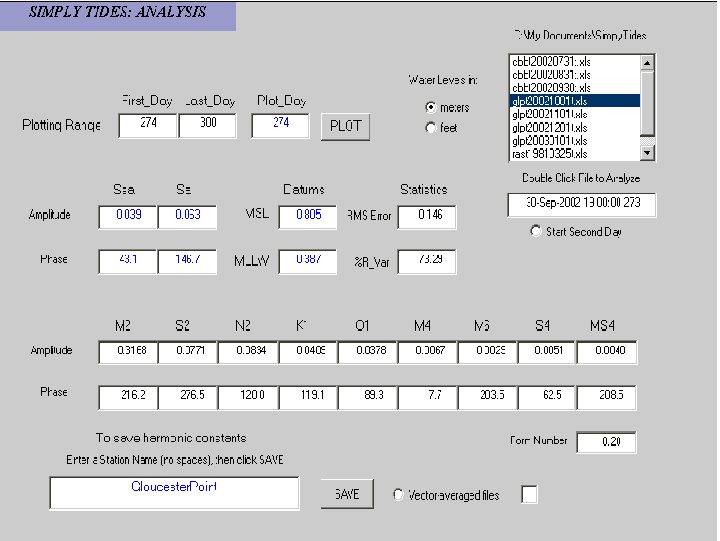
The Tidal Analysis program reads a 29-day water level record and determines amplitude and phase for nine of the major tidal harmonic constituents (M2 through MS4) using HAMELS (Harmonic Analysis, Method of Least Squares). The results appear in the boxes with black numerals. When available from the NOAA National Ocean Service web site (http://co-ops.nos.noaa.gov), the amplitude and phase of the Solar Semiannual (Ssa) and Solar Annual (Sa) seasonal constituents can be added along with accepted NOS tidal datums (MSL, MLLW) at selected stations – the user enters the data manually in the boxes containing blue numerals. You can then save these “tidal constants” (or a vector-averaged series of constants from multiple analyses) in a binary file by entering a station name and pressing SAVE. The user can also generate detailed plots of the observed, fitted, and residual data curves for any three-day segment of the record.

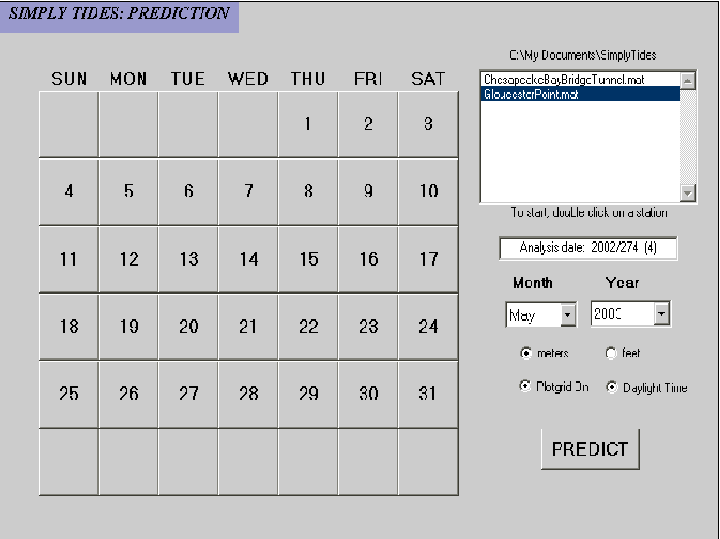
The Tidal Prediction program allows the user to make daily predictions of tidal height at any location with a set of tidal constants derived by the author’s tidal analysis program. After double clicking on a station name, selecting a month and year, a numbered calendar appears on the GUI when the PREDICT button is pressed. Pressing any of the dates shown will produce an annotated tide graph in meters or feet at that station.

SIMPLYCURRENTS – A SET OF MATLAB PROGRAMS FOR TIDAL CURRENT ANALYSIS AND PREDICTION USING MATLAB VERSION 6 GRAPHICS AND GUIs – by John Boon
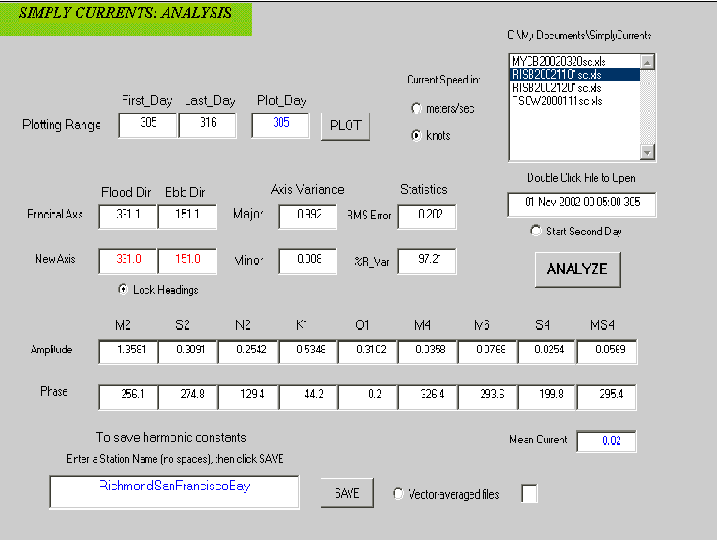
The Tidal Current Analysis program reads a 14-day water current record and finds the principal axis of the horizontal current. After the user enters flood and ebb headings for the principal axis – or some other axis – the program determines amplitude and phase for nine of the major tidal harmonic constituents (M2 through MS4) for flow along the selected axis (black numerals shown below). The 14-day mean current, shown in blue numerals, can be used as is or reset to zero or another value. Tidal current constants for a single file can be saved (or several files can be vector-averaged and saved) for use in generating tidal current predictions. The user can also generate detailed plots of the observed, fitted, and residual data curves for any three-day segment of the record.

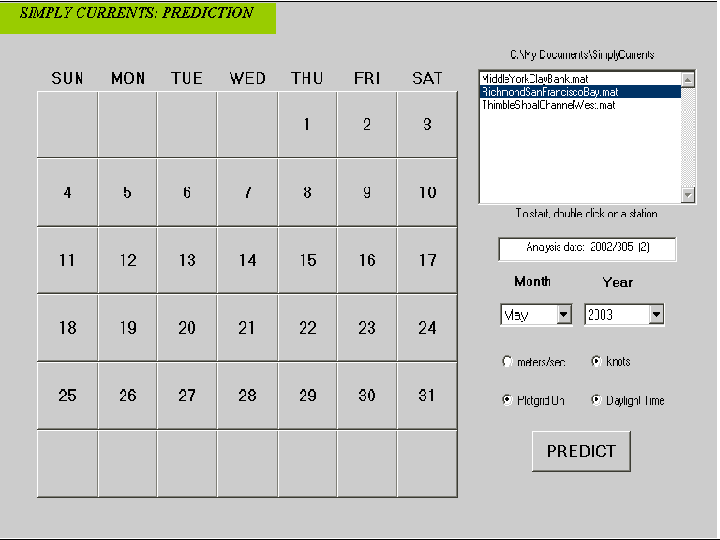
The Tidal Current Prediction program allows the user to make daily predictions of tidal current at any location with a set of tidal current constants derived by the author’s tidal current analysis program. After double clicking on a station name, selecting a month and year, a numbered calendar appears on the GUI when the PREDICT button is pressed. Pressing any of the dates shown will produce an annotated tidal current graph at that station in meters/sec or knots.

Want good tide and current predictions? Look for fresh tide and current data, not old tidal constants.
Thank you for your interest in my tide and tidal current analysis and prediction programs. You can now download them at no cost from the Mathworks Central File Exchange: www.mathworks.com/matlabcentral/fileexchange/ (search keyword ‘tides’). Depending on the MATLAB version you are using you should select either the combined program WorldTides_WorldCurrents2010 (latest version) or the separate programs - World Tides, World Currents – for earlier ones.
You might also be interested in my book: “Secrets of the Tide: Tide and Tidal Current Analysis and Applications, Storm surges and Sea Level Trends”, Horwood Publishing, Chichester, UK, 2007. It’s available from Amazon.com and includes chapters on tidal harmonic analysis using my programs.
Best wishes for success in your work,
John Boon
