Survey: another good year for Bay’s underwater grasses
2016 increase marks 4th-straight year with positive trend
An annual survey led by researchers at the Virginia Institute of Marine Science shows the abundance of underwater grasses in Chesapeake Bay increased 8% between 2015 and 2016, continuing an upward trend initiated in 2012.
The increase makes 2016 the second consecutive year since VIMS began its aerial survey in 1984 that the baywide acreage of submerged aquatic vegetation (SAV) has reached a new high. A total of 97,433 acres of SAV were mapped in Chesapeake Bay during 2016.
Professor Robert “JJ” Orth, head of the SAV Monitoring and Restoration Program at VIMS, says “It was an impressive year, following on a previously impressive year. We are at numbers that we have not seen in—ever.”
The increase comes despite weather conditions and security restrictions that prevented acquisition of aerial imagery for portions of the Potomac River. “Even though we were unable to map a couple of areas that we know have a lot of SAV,” says Orth, “we are remarkably still above the 2015 baywide levels.”
David Wilcox, a GIS analyst in the SAV program at VIMS, notes that substituting 2015 data for the areas not mapped in 2016 would bring the baywide total to just short of 100,000 acres—10,000 acres above the Bay Program’s interim restoration goal of 90,000 acres by 2017. And that estimate is “a little conservative,” says Wilcox, “since coverage everywhere else in that area increased from 2015 to 2016.”
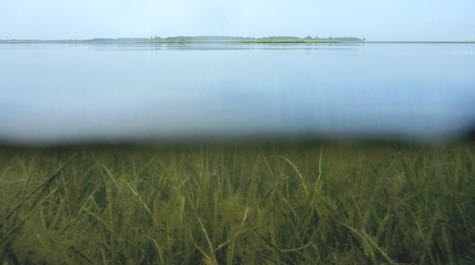
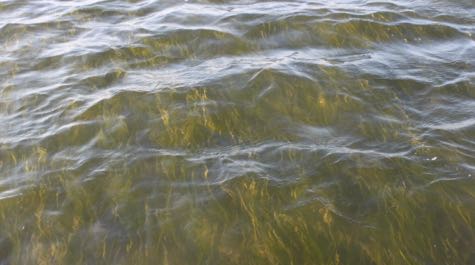
 Underwater bay grasses are critical to the Bay ecosystem. They provide habitat and nursery grounds for fish and blue crabs, serve as food for animals such as turtles and waterfowl, clear the water by reducing wave action, absorb excess nutrients, and reduce shoreline erosion. They are also an excellent measure of the Bay's overall condition because their health is closely linked to water quality.
VIMS tracks the abundance of underwater grasses as an indicator of Bay health for the Chesapeake Bay Program, the federal-state partnership established in 1983 to monitor and restore the Bay ecosystem. VIMS researchers estimate the acreage of underwater grasses through aerial surveys flown from late spring to early fall.
Nick DiPasquale, Chesapeake Bay Program director, says the VIMS report “further supports our assessment that we’ve reached a tipping point for numerous indicators that we use to determine watershed health. The ecosystem is responding to the pollution-control measures that jurisdictions have implemented: controlling discharges from wastewater treatment plants, stormwater, and agricultural runoff. These investments are showing their return in terms of environmental improvement throughout the watershed. What we are doing is working. We just need to do more of it.”
The $64,000 question
For 2016, the VIMS team continued the practice— first introduced in 2013—of categorizing abundance using 4 different salinity zones, which are home to underwater grass communities that respond similarly to storms, drought, and other growing conditions. Reporting abundance by salinity zone makes it easier for scientists to connect changes in grass communities with changes in growing conditions through time. The 4 zones are tidal fresh, slightly salty (oligohaline), moderately salty (mesohaline), and full salinity (polyhaline).
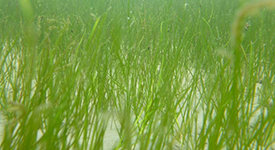 The VIMS team attributes this year’s boost in the abundance of underwater grasses primarily to a major expansion of widgeon grass in the Bay’s moderately salty waters.
“The increase for the mesohaline is pretty impressive,” says Orth. “We started with a low in 2012, and it’s just been a meteoric rise through 2016. In fact, widgeongrass abundance in these areas has almost tripled.”
Orth and Wilcox temper this positive trend by noting that widgeongrass is a “boom-or-bust” species that has experienced sharp die-offs in past years.
“We keep waiting for the crash,” says Orth, “but it hasn’t happened. Whether this is because the Bay is getting warmer, making life comfortable for widgeongrass, we don’t know.”
“We saw about a 50% decrease in widegeongrass in 2003,” says Wilcox. “If that were to happen next year, our story would be very different. We have no idea, really, what drove that 2003 decrease.”
“It’s always the $64,000 question,” adds Orth. “What is driving widgeongrass and why have we seen it persist for 4 or 5 years at very high levels?”
Abundance by Salinity Zone
Changes in the abundance of underwater grasses between 2015 and 2016 in the Bay’s other salinity zones was mixed. The oligohaline and polyhaline salinity zones saw a decrease, while abundance in the tidal fresh zone increased slightly (likely a conservative estimate given the mapping issues mentioned previously). The VIMS team was unable to estimate changes in SAV abundance in Virginia’s coastal bays due to unfavorable weather conditions that precluded acquisition of aerial images in these areas during 2016.
For a detailed look at the abundance of underwater grasses in each of the four salinity zones, visit our interactive charts.
