Detailed Methods
Stratified Random Survey
A stratified random dredge survey for blue crab in Chesapeake Bay has been conducted between December and March each year since 1989/1990. Each survey year is referred to by the latter year of the sampling season (i.e., 1990). A crab dredge is employed in the survey to sample the crab population during winter, while crabs are dormant and buried in the sediment (Rothschild et al., 1992; Zhang and Ault, 1995). The primary objectives of the annual survey are to:

- describe the size and sex composition of the baywide population,
- develop accurate estimates of baywide blue crab abundance, and
- estimate exploitation and fishing mortality and evaluate the status of the stock annually.
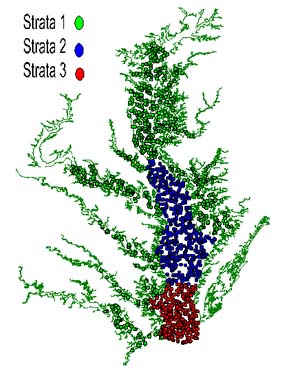
Between 877 and 1,500 stations have been sampled each year since 1990 (Table 1) in waters deeper than 1.5 m (areas shallower than 1.5 m were not accessible to the boats used in the survey). The sampling program evolved from a pilot survey conducted during the winter of 1989 (Rothschild et al., 1992). The spatial coverage, stratification, and allocation of stations to strata varied before the design was standardized in 1994 (Table 1). In 1990 and 1991 the Bay was divided into 25 and 22 strata respectively; most of the rivers and major parts of the Bay formed separate strata. Since 1992, three fixed geographic strata have been employed:
- the Upper Bay and rivers
- the Middle Bay, and
- the Lower Bay.
Stratum 1 represents mostly shallow waters with low salinity (0–10 ppt), where the winter population is dominated by young-of-year crabs and adult males. Stratum 3 has higher levels of salinity (25–35 ppt), deeper waters and is inhabited primarily by mature females in winter. Stratum 2 is an intermediate area.
Table 1. Winter dredge survey design and total effort, 1990-1999 |
|||
| Year | Design & Geographic Strata |
Sampling Area (km2) | # of stations |
| 1990 | Stratified random, 25 strata | 7,940 | 9041 |
| 1991 | Stratified random, 22 strata | 7,940 | 8771 |
| 1992 | Stratified random, 3 strata, 2 sediment sub-strata | 11,057 | 9361 |
| 1993 | Stratified random with station allocation proportional to strata area , 3 strata | 10,140 | 964 |
| 1994–present | Stratified random with station allocation proportional to strata area, 3 strata | 9,812 | 1,248–1,500 |
| 1 Two tows were made at each station | |||
The use of a small number of strata is often advantageous for marine resource surveys when the total sample size is fixed (Pennington, 1996; Pennington and Strømme, 1998). In 1992, each of the three geographic strata was divided into two substrata, with low (0–80%) and high (81–100%) gravel content, respectively (Rothschild et al., 1992). Survey results indicated that substratification by sediment type produced only marginal gains in precision (Vølstad et al., 1994). The sediment stratification was problematic because no accurate map of sediment distribution across Chesapeake Bay exists; the size of each substratum was estimated from sediment samples. The sediment distribution may vary over time because of currents and tidal effects and can also vary along the length of a standard haul. For such reasons, the exact areas of the sediment substrata cannot be obtained from available data.
The use of inaccurate substrata areas (weights) introduces a bias in estimates of mean and total abundance (see Cochran, 1977: 117); therefore substratification was discontinued in 1993. After eliminating the sediment sampling, less time was spent at each survey station, and the average number of stations sampled per day increased. Eliminating the laboratory processing of sediment samples also reduced the cost of the survey. Since 1993, the number of sites in each geographic stratum has been proportional to the area of that stratum. Two replicate tows were conducted at each station from 1990 until 1992. For this period we used the average of the replicate tows to calculate crab density at each station. Rothschild et al. (1992) and Vølstad et al. (1994) demonstrated that catches from replicate tows within stations were correlated (r2 varied between 0.5 and 0.7 across years), and thus the extra tow at each station only resulted in a marginal increase in precision as compared to single tows. For a fixed survey cost, it is therefore more effective to take single tows and use the time saved to increase the number of stations (Pennington and Vølstad, 1994). For a correlation of 0.6, for example, 125 independent tows yield density estimates with approximately the same precision as 200 tows from 100 random stations. Only one haul was taken at each station during and after 1994, resulting in an increase of more than 25% in the number of stations that could be sampled per day, therefore increasing the precision for fixed survey cost.
Field Methods
At each station, a 1.83-m wide Virginia crab dredge is towed along the bottom for one minute at a speed of 5.4 km per hour (3 knots). The dredge liner is composed of either galvanized poultry wire, nylon, or polyethylene mesh. Galvanized poultry liner was used in stratum 1 (Upper Bay) and stratum 2 (Middle Bay) from 1990 to 1994, when it was replaced with nylon. The polyethylene mesh has been used in stratum 3 (Lower Bay) since 1990. The dredge, with a 1.3-cm liner, retains crabs with a carapace width (CW) larger than 15 mm (Cargo, 1954; Sulkin and Miller, 1975) and occasionally catches smaller crabs. The distance of each haul was determined by LORAN546-C (1989–1995) or Differential Global Positioning System (1996–1999) readings of latitude/longitude at the start and end of each haul; the area swept was estimated by multiplying the towing distance with the dredge width (1.83 m). Depth at the start and end of each haul, water temperature, and salinity were recorded at each station. All crabs in the catch were measured to the nearest mm from point to point, weighed to nearest 0.1 g, and their sex and maturity stage determined.
Depletion Experiments
Since 1992, each vessel participating in the winter dredge survey has conducted depletion experiments to estimate the dredge’s catching efficiency (Zhang et al., 1993; Vølstad et al., 2000). The efficiency experiments generally were conducted at a random subset of survey stations with medium to high crab density. Each experiment consisted of up to ten depletions of a 100-m by 5.5-m area (three dredge widths) in Maryland or a 100-m by 9-m area (five dredge widths) in Virginia, marked by buoys. Dredge tows were made in a random order. The experiment ended if two consecutive tows did not catch crabs.
Estimating Catching Efficiency to Calibrate Swept-Area Estimates
An exponential model was used to estimate the gear efficiency, or catchability coefficient (q), for each experiment (Seber, 1973; Vølstad et al., 2000):
yi = q(1 -q)i-1P0ε (1)
where yi is the number of crabs caught in the ith coverage, P0 is the number of crabs present in the experimental area, and ε is a random error. This model is linearized by a loge transformation:
loge(yi) + loge(q) + {loge(1 - q)}(i - 1) + loge(P0) + loge(ε) (2)
and the parameters are estimated using linear regression. The catchability coefficient is then estimated from the slope {loge(1 - q)}, after re-transformation following the method of Finney (1941). The distribution of crabs is typically patchy, and the mean density is sensitive to relatively few large catches. We estimated a weighted mean catchability coefficient for vessel j in year k as
qjk = Σ cijkqijk/Cjk (3)
where cijk = cumulative number of crabs caught in the ith experiment by vessel j in year k, qijk is the estimated catchability coefficient, and Cj,k is the total number of crabs caught in n experiments by vessel j in year k. Because the number of experiments per vessel was small (≤10), mean catchability and its standard error were calculated using a jackknife estimator (Efron and Tibshirani, 1994).
Testing for Year and Vessel Effects in Catching Efficiency
The catchability coefficients estimated from 203 depletion experiments were analyzed using a two-way unbalanced ANOVA (GLM procedure, SAS Institute, 1989) to determine temporal or vessel/area related differences in catchability. The model was specified as:
qijkn = m + Vj + Tk + Ln + VjTk + ε (4)
where qijkn is the catchability estimate for the ith experiment involving the jth vessel with dredge liner Ln in the kth year, Vj (j = 1, 2, 3, 4) is a vessel/area effect, Tk (k = 1, . . . , 10) is a year effect, Ln (n = 1, 2, 3) is a liner effect, VjTk is an interaction between vessel/area and year, and ε is random error. To account for the potential effect of the number of crabs at the experimental site on the estimate of catchability coefficient, the number of crabs caught in each depletion experiment was included as a covariate in the model.
Estimating Density and Abundance
Let xhijk denote the catch per area swept (numbers per m2) at station i in stratum h by vessel j in year k, and let qjk denote the dredge-catching efficiency for vessel j in year k estimated from equation (3). For each survey, the absolute number of crabs per m2 at station i in stratum h is estimated as
yhi = xhijk/qjk (5)
and the mean density of crabs in stratum h for year k is estimated by
 (6)
(6)
with variance
 (7)
(7)
where nh,k is the number of hauls in stratum h in year k. The stratified mean density for the entire survey area in year k is estimated by
 (8)
(8)
with variance
 (9)
(9)
where Lk is the number of strata in year k, and Wh is the proportion of the total survey area in stratum h. The absolute abundance (total number of crabs) in the Chesapeake Bay for year k is estimated by extrapolating the mean density for that year to the entire area A,
τk = A X ýst,k (10)
and the variance of the total abundance estimate is estimated by
var(τk) = A2 var(ýst,k) (11)
We assume that the estimated mean density (eqs. 5–9) in any year is representative for the entire distribution area for blue crabs in the Chesapeake Bay, although the surveys did not provide complete coverage. Shallow waters (depth < 1.5 m) that constitute about 10% of the total Bay area, were sampled with a limited number of stations in 1992 and 1993 using a small modified dredge. Density estimates derived from shallow waters were not significantly different than those derived for the area deeper than 1.5 m (Rothschild et al., 1992). Absolute abundance was estimated by expanding crab density for every year to the total bay area, estimated at 9,812 km2 by GIS.
Testing for Trends
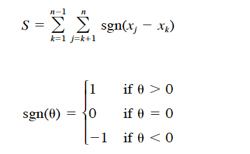
We followed Hirsch et al. (1982) and used the Kendall test for trend in abundance over the n sampling occasions (10 years in this analysis). Let xj and xk be estimated absolute abundance in years j and k, respectively. The Kendall test statistic S is defined as
 (12)
(12)
Under null hypothesis the mean and variance of S is

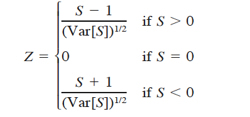
where t is the number of x’s involved in a given tie, and Σt denotes the summation of all ties. A negative value of S represents a negative trend in abundance over the ten years analyzed. Kendall’s S has an approximate normal distribution for n = 10 (Hirsch et al., 1982); therefore, the test for trends is based on the standard normal test statistic Z, computed as
 (13)
(13)
In a two-sided test for trend, the null hypothesis can not be rejected if |Z| ≤ za/2, with α being the significance level of the test.
Estimating Exploitation and Fishing Mortality Rates
An estimator of exploitation rate U of the Chesapeake Bay blue crab population is C
U = C/N (14)
where C is the total annual catch in numbers and N is number of crabs available to the fishery, estimated as the absolute abundance of crabs in winter preceding spring through fall fishing season (Ricker, 1975). Total catch in numbers was estimated from catch in weight data assuming an average individual weight of 150 g (Knotts, 1989), which corresponds to mean CW = 147 mm. We derived fishing mortality estimates iteratively by using Baranov’s catch equation (Ricker, 1975):
 (15)
(15)
where F is instantaneous fishing mortality, and M is natural mortality. Natural mortality was assumed to be equal to 0.375 year-1 following Rugolo et al. (1998).
Overwintering Mortality
Since 1996, a subset of sites from the random survey performed in December and January, were resampled in February and again in March to measure overwintering mortality. In 1996, 59 sites were selected for mortality sampling, and in 1997 sampling was expanded to 150 sites, all in Maryland’s portion of the Bay. The same design was used in 1998 and 1999. Repetitive sampling indicated that the percentage of dead crabs increases towards the end of winter; therefore, for the period before 1996, March samples from the random survey were used to develop a time series of mortality estimates. A regression analysis was conducted to explore a relationship between crab mortality and water temperature. Lowest bottom temperature typically occurs in February. Although bottom temperature data were not available for the entire time period, we found that mean bottom temperatures in February and mean surface temperatures in January were highly correlated (r2 = 0.91, P = 0.004). We regressed January surface temperature with the percentage of dead crabs collected during March from 1990 through 1998 to determine if there was a significant relationship between mortality and temperature.
