Trends
Low-oxygen "dead zones" are increasing around the world

Global Patterns
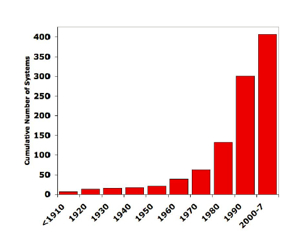
A seminal 2008 study by Professor Robert Diaz of the Virginia Institute of Marine Science (VIMS) reported more than 400 dead zones in coastal and estuarine waters worldwide, up from the 305 dead zones recorded in his first report in 1995. That same 1995 study counted 162 dead zones in the 1980s, 87 in the 1970s, and 49 in the 1960s. Diaz first found scientific reports of dead zones in the 1910s, when there were 4. Globally, the number of dead zones has approximately doubled each decade since the 1960s. The first dead zone in Chesapeake Bay was reported in the 1930s.
Looking further back, geologic evidence shows that low-oxygen "dead zones" were not a naturally recurring event in most estuarine ecosystems, including Chesapeake Bay.
Today, many ecosystems experience a progression in which periodic hypoxic events become seasonal and then, if nutrient inputs continue to increase, persistent. Earth’s largest dead zone, in the Baltic Sea, experiences hypoxia year-round. Chesapeake Bay experiences seasonal, summertime hypoxia through much of its main channel.
Annual Chesapeake Bay Hypoxia Report Card
Each year, the Virginia Institute of Marine Science and Anchor QEA release a retrospective seasonal analysis of the severity of hypoxia in the Chesapeake Bay. The Annual Chesapeake Bay Hypoxia Report Card summarizes dissolved oxygen concentrations in the Bay as estimated by the team's 3-D, real-time hypoxia forecast model. The modeling team also generates the same dissolved oxygen statistics for previous years for comparative purposes.
